
Tableau
Paid
Connect to databases, drag and drop to create visualizations, and share insights through cloud, server, or desktop deployment options with integrated AI-assisted analytics.
About
Tableau is business intelligence software for Data & Analytics work. You connect to data, build charts and dashboards with drag-and-drop, and share what you find.
It started as a desktop tool. Now it lives in the cloud, on servers, and inside Salesforce. You pick where it runs based on your setup and rules.
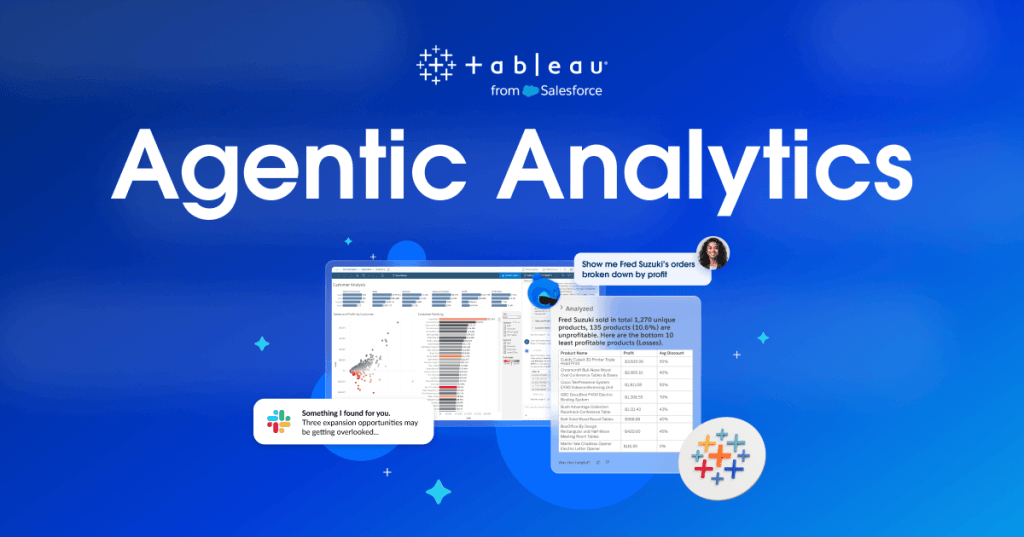
The AI parts—Ask Data, Pulse, Agent—sit on top. They help when your data is clean and your questions are simple. They stumble when dates get tricky or you need real math.
Open it if you need governed, shareable visuals and have time to learn. Skip it if you want quick answers without setup or training.
Who Tableau is best for
It fits when you have the people and budget to run it right.
- Enterprise teams with dedicated admins and analysts: You get control over who sees what. Governance works when someone owns it.
- Organizations heavily invested in Salesforce: The integration actually helps. Data flows without extra pipes.
- Teams needing standardized visualizations with technical support: You get consistent reports across departments. IT can fix what breaks.
- Companies with budget for extensive training and infrastructure: Your people learn the tool properly. Performance stays acceptable.
- Data analysts and BI developers needing advanced customization: You can build exactly what leadership wants. The depth is there if you dig.
- Teams prioritizing governance and internal analytics over speed: You trade some pace for accuracy. Audit trails matter more than instant answers.
- Organizations with compliance requirements needing audit controls: Einstein Trust Layer tracks who did what. Regulators see the paper trail.
- Teams wanting proactive monitoring through Slack integration: Pulse pushes alerts where you already work. You catch problems early.
- HR teams needing sophisticated interactive workforce dashboards: Your executives see board-ready turnover and headcount. No analyst bottleneck for every request.
Best things about Tableau
These keep you coming back after the learning curve.
- Drag-and-drop visualizations: You build charts without code. The first one takes minutes, not hours.
- Broad data connectivity: You hook into Excel, SQL databases, Snowflake, Salesforce. One tool for your scattered sources.
- Tableau Pulse for proactive alerts: You get anomaly warnings in Slack. Metrics drift gets caught before the monthly report.
- Highly customizable Data Stories: You define exactly what the narrative explains. Six tabs let you tune the insight.
- Strong mobile responsiveness: Your dashboards adapt automatically. Executives check numbers on phones without squinting.
Why you should ignore it
Skip it when these limits block your work.
- Ask Data fails on date filters: You ask "best in 2022" and get all-time results. You fix it manually every time.
- Steep learning curve for business users: You need months of training to move past basic charts. Self-service is a stretch.
- Expensive scaling and licensing: You pay per user and tier. Small teams feel the cost fast.
- Performance slows with complexity: Your snappy dashboard lags once filters and blends pile on. You start simplifying to speed it up.
- Embedded analytics needs code: You want it in your app. Be ready to write and maintain that integration.