
Parse.ly
Paid
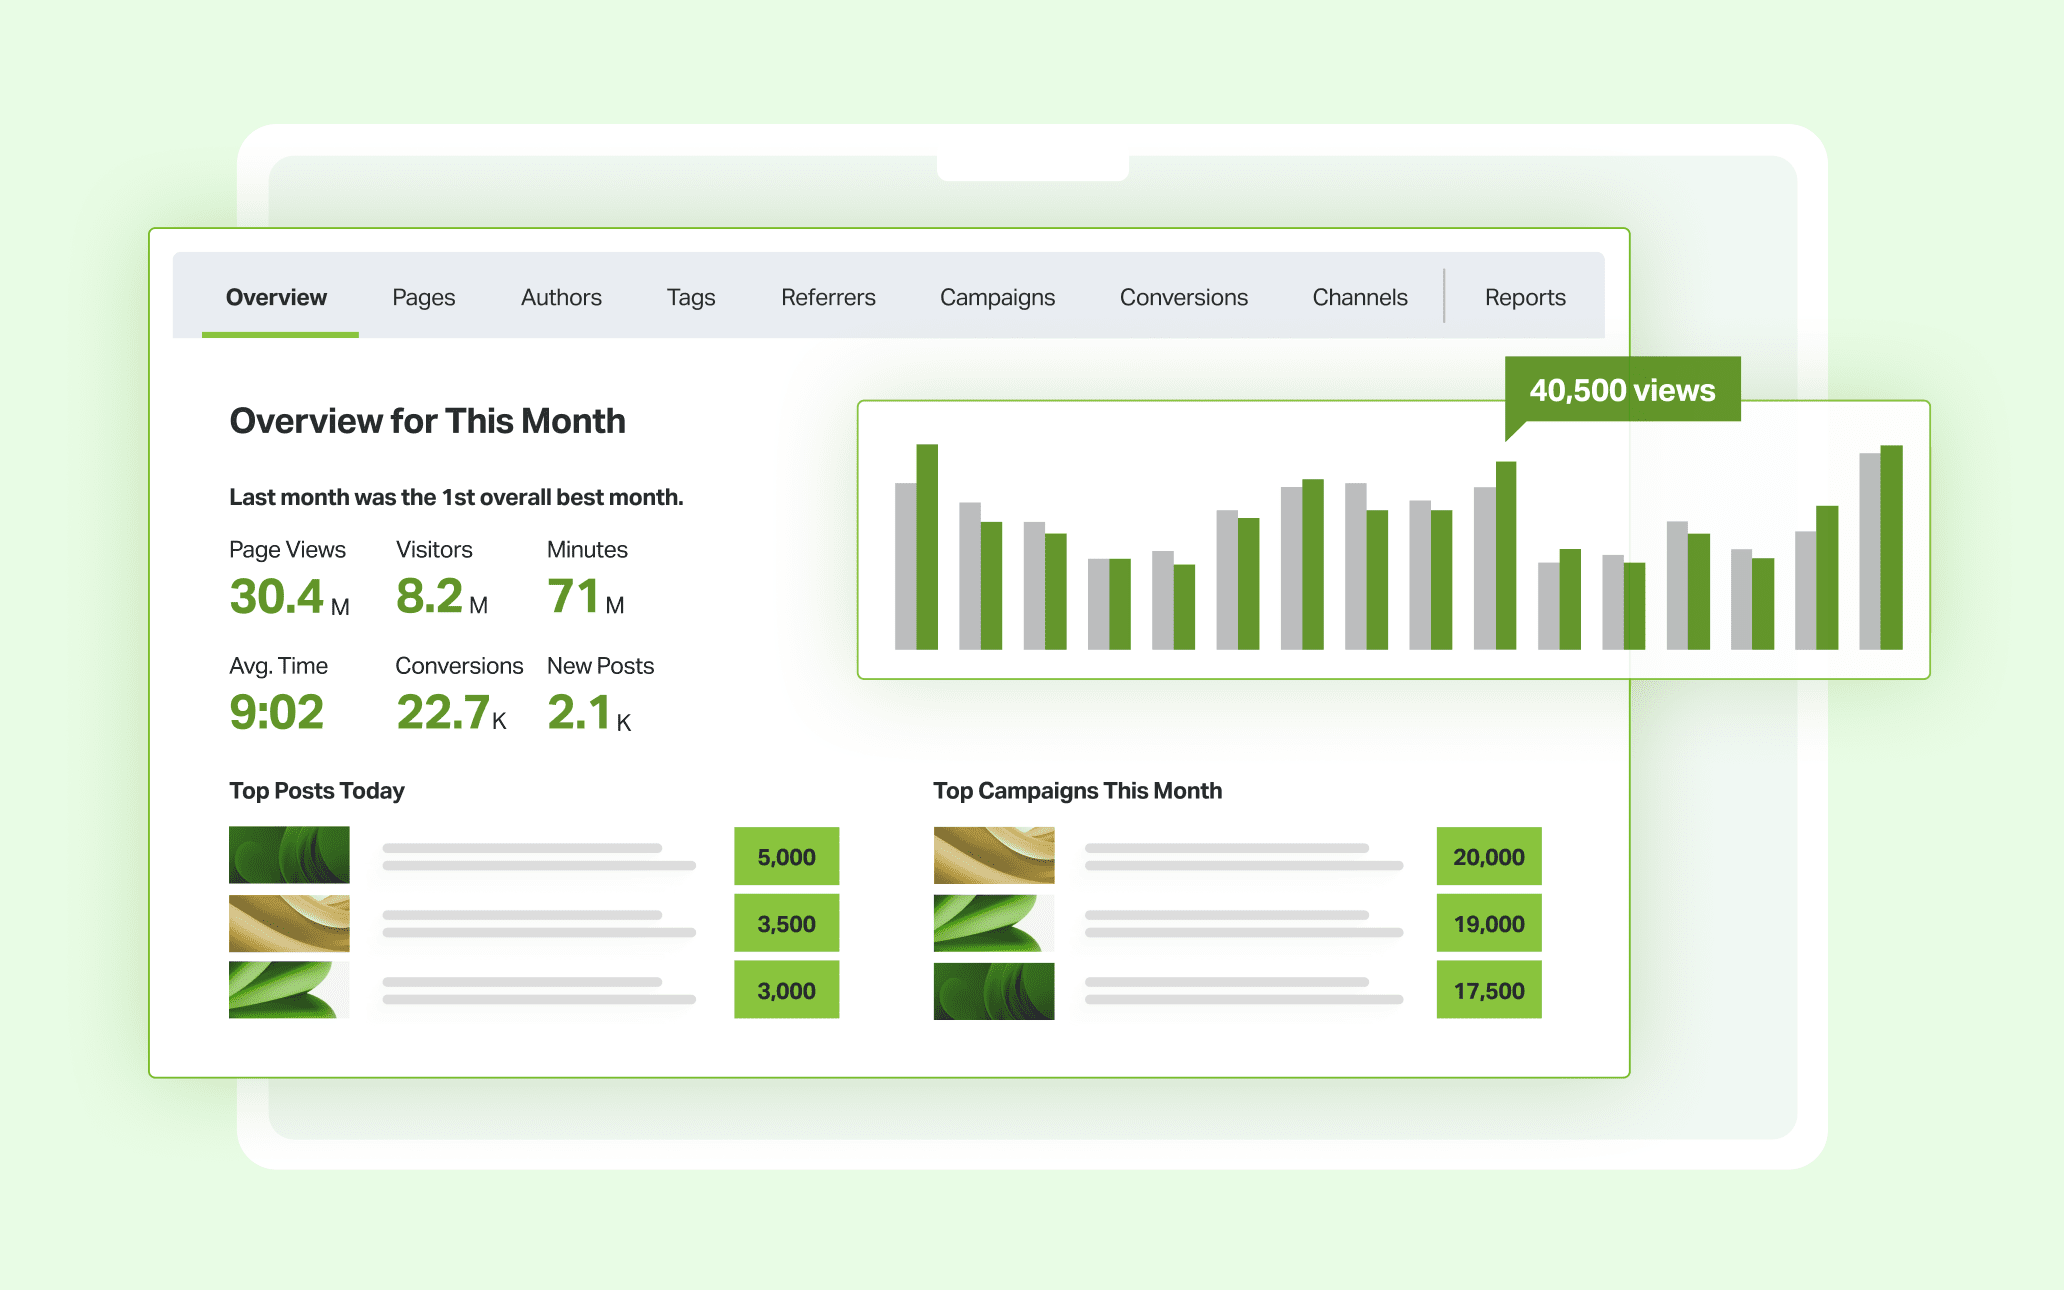
Track content performance with real-time analytics, measure reader engagement, and export data to warehouses through a dashboard, API, or pipeline.
About
Parse.ly is a content analytics platform for publishers. It sits in Data & Analytics work. It tracks what readers do, then turns that into reports you can act on.
The platform has four parts. A dashboard shows content performance. An API serves personalized recommendations. A pipeline exports raw data. And Sage answers questions in plain English.
It is built for editorial teams who need to know what works without using generic web analytics.
Open it if you run a publication and need to know what content resonates. Skip it if you need minute-by-minute traffic spikes or free tools.
Who Parse.ly is best for
These are the teams that get the most from it.
- Small newsrooms publishing few stories daily: Historical patterns matter more than real-time spikes. You see what works over weeks, not minutes.
- Teams without dedicated data analysts: No coding needed for WordPress. Journalists can read the dashboards without training.
- Subscription-model publications tracking loyal readers: You follow which content drives conversions. Engaged time shows quality even when traffic stays modest.
- WordPress-based publishers: A native plugin handles setup. You enter details in boxes, not code.
- Editorial teams drowning in spreadsheets: Sage lets you ask plain-English questions. You get answers without drilling through menus.
- Content strategists who need quick answers: Composite rankings show what to write next. Evergreen suggestions resurface old work.
- Editorial teams monitoring content away from desk: The iOS app shows trending posts and metrics on mobile. iPad multitasking puts analytics beside your CMS.
- Small to medium-sized businesses: The interface is friendly. The learning curve stays shallow.
Best things about Parse.ly
These are the parts you notice after a few weeks.
- Engaged time with heartbeat tracking: It catches mouse moves, scrolling, and touches. You see actual reading time, not just page loads.
- Historical pattern analysis: You compare today against your own baselines. Trends become clear without spreadsheet work.
- Plain-English queries in Sage: You ask what drove yesterday's spike. It answers in sentences, not charts.
- WordPress integration: Install the plugin and go. No developer needed to start.
- Competitive intelligence: You benchmark articles against your own history. Strategy gets data behind it.
Why you should ignore it
Skip it when these limits block your work.
- High-volume newsrooms needing minute-by-minute analysis: Parse.ly is slower. Chartbeat suits that rhythm better.
- Teams on tight budgets: Entry pricing runs around $2,000 per month. Enterprise contracts hit $86,000 average. This is not a free or cheap tool.
- Custom CMS without developer support: You need JavaScript implementation. The no-code promise only holds for WordPress.
- Teams wanting social platform detail: It cannot tell which specific social network shared your link. You lose distribution clarity.
- Mobile-only users: The iOS app is narrow. You need a full account first, and features stay limited next to the web dashboard.